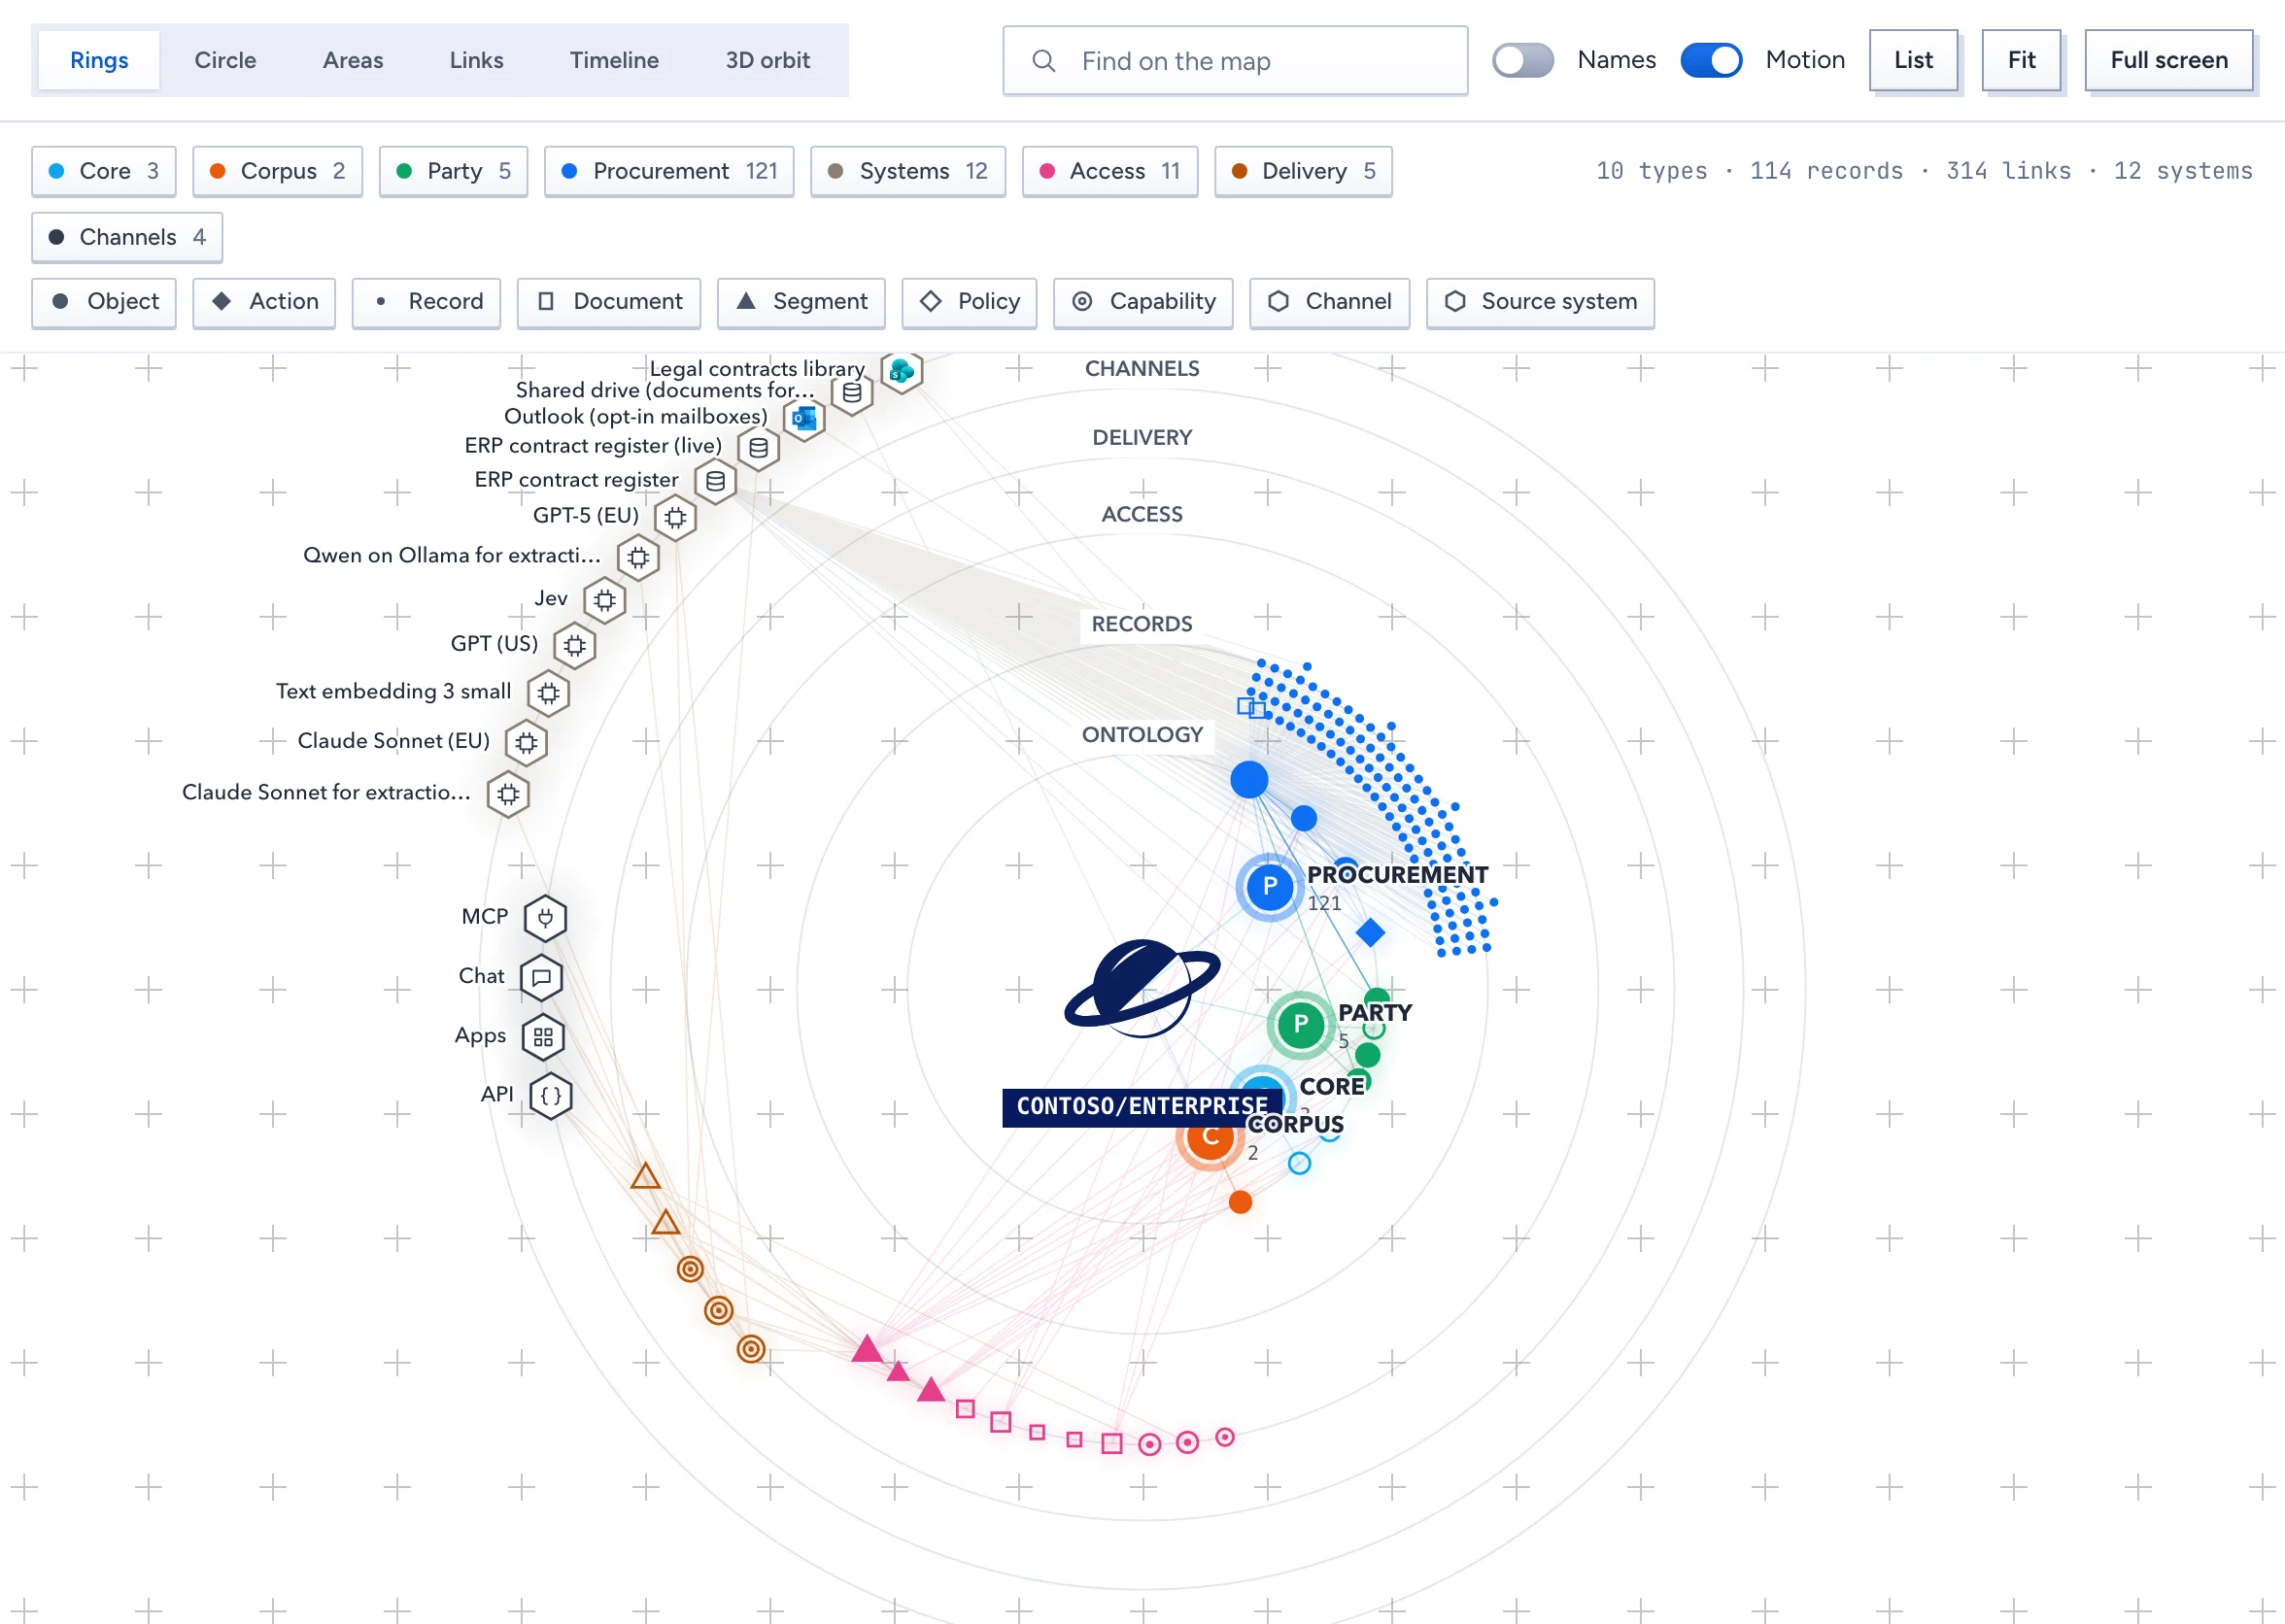
The System map draws everything you may see in one picture: the package in the middle, its domains with their types and records, who gets it (segments, audiences, policies), what delivers it (capabilities, deployments, channels) and the backend systems it reads from and writes to. Open it from Health & pipeline › System map in the admin console, next to Live activity.
The map shows only what your own access lets you see. Types come from the segments deployed to you. Records are the ones chat would read for you, on the device you are using now. Security, delivery and backend systems appear only if you can read the whole package. Nothing hidden from you is drawn, not even as a blank spot.
Read the picture
- Colour is the area: each domain has its own colour, access is pink, delivery amber, channels white and systems grey.
- Shape is the kind: a filled circle for an object, a ring for an interface, a diamond for an action, a small dot for a record, a square for a document, a triangle for a segment. A hexagon is a channel or a backend system, drawn with the system's own logo where Gluon has one (SharePoint, Outlook).
- Size grows with the number of links.
- With Motion on, small packets travel along the links: data from a backend into a type and its records, and from an action back out to the system it writes to.
Six views of the same nodes
Pick a view at the top, or press 1 to 6. The nodes move from one view to the next, so you can follow one thing across views.
- Rings: the package in the middle, drawn as the Gluon mark, then rings for the ontology, records, access, delivery, channels and systems. Each area keeps its own slice of every ring.
- Circle: every node on one ring, links as curves across the middle. Records take small steps, so the model stays readable.
- Areas: one cluster per area, its domain in the middle and its records around it.
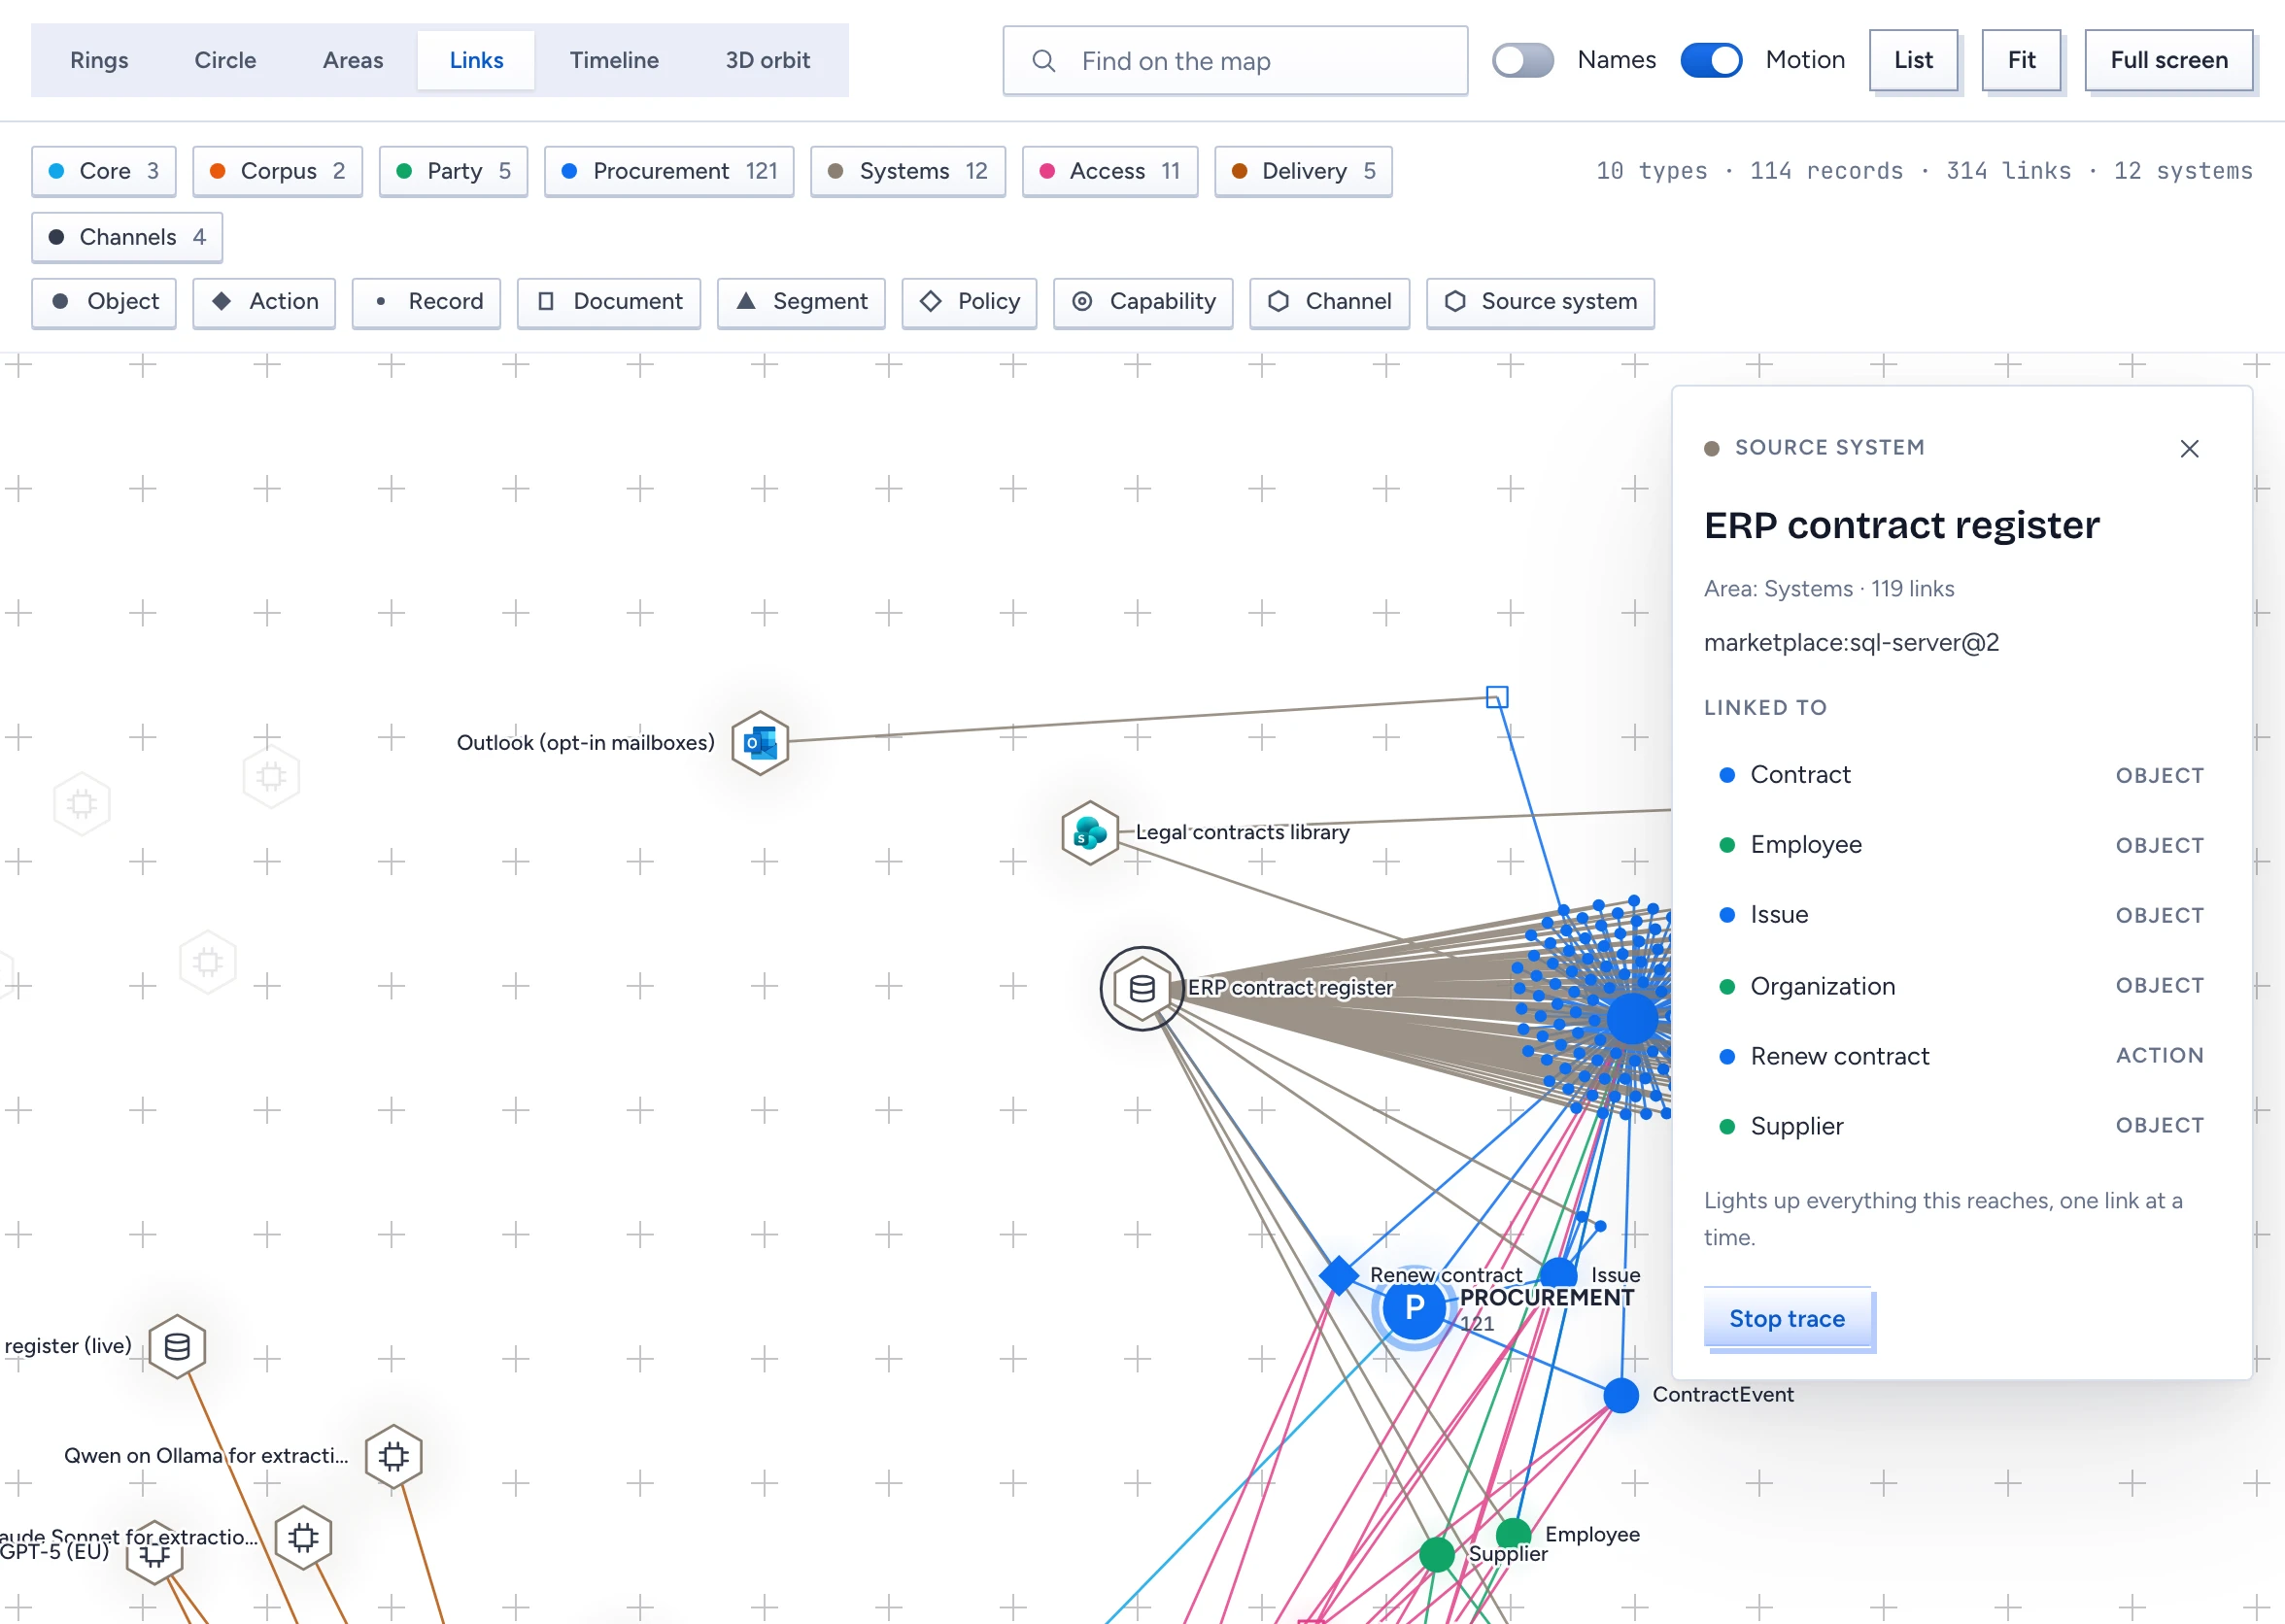
- Links: a force layout, so things that link to each other sit together. Records gather around their type, and types around the backend that feeds them.
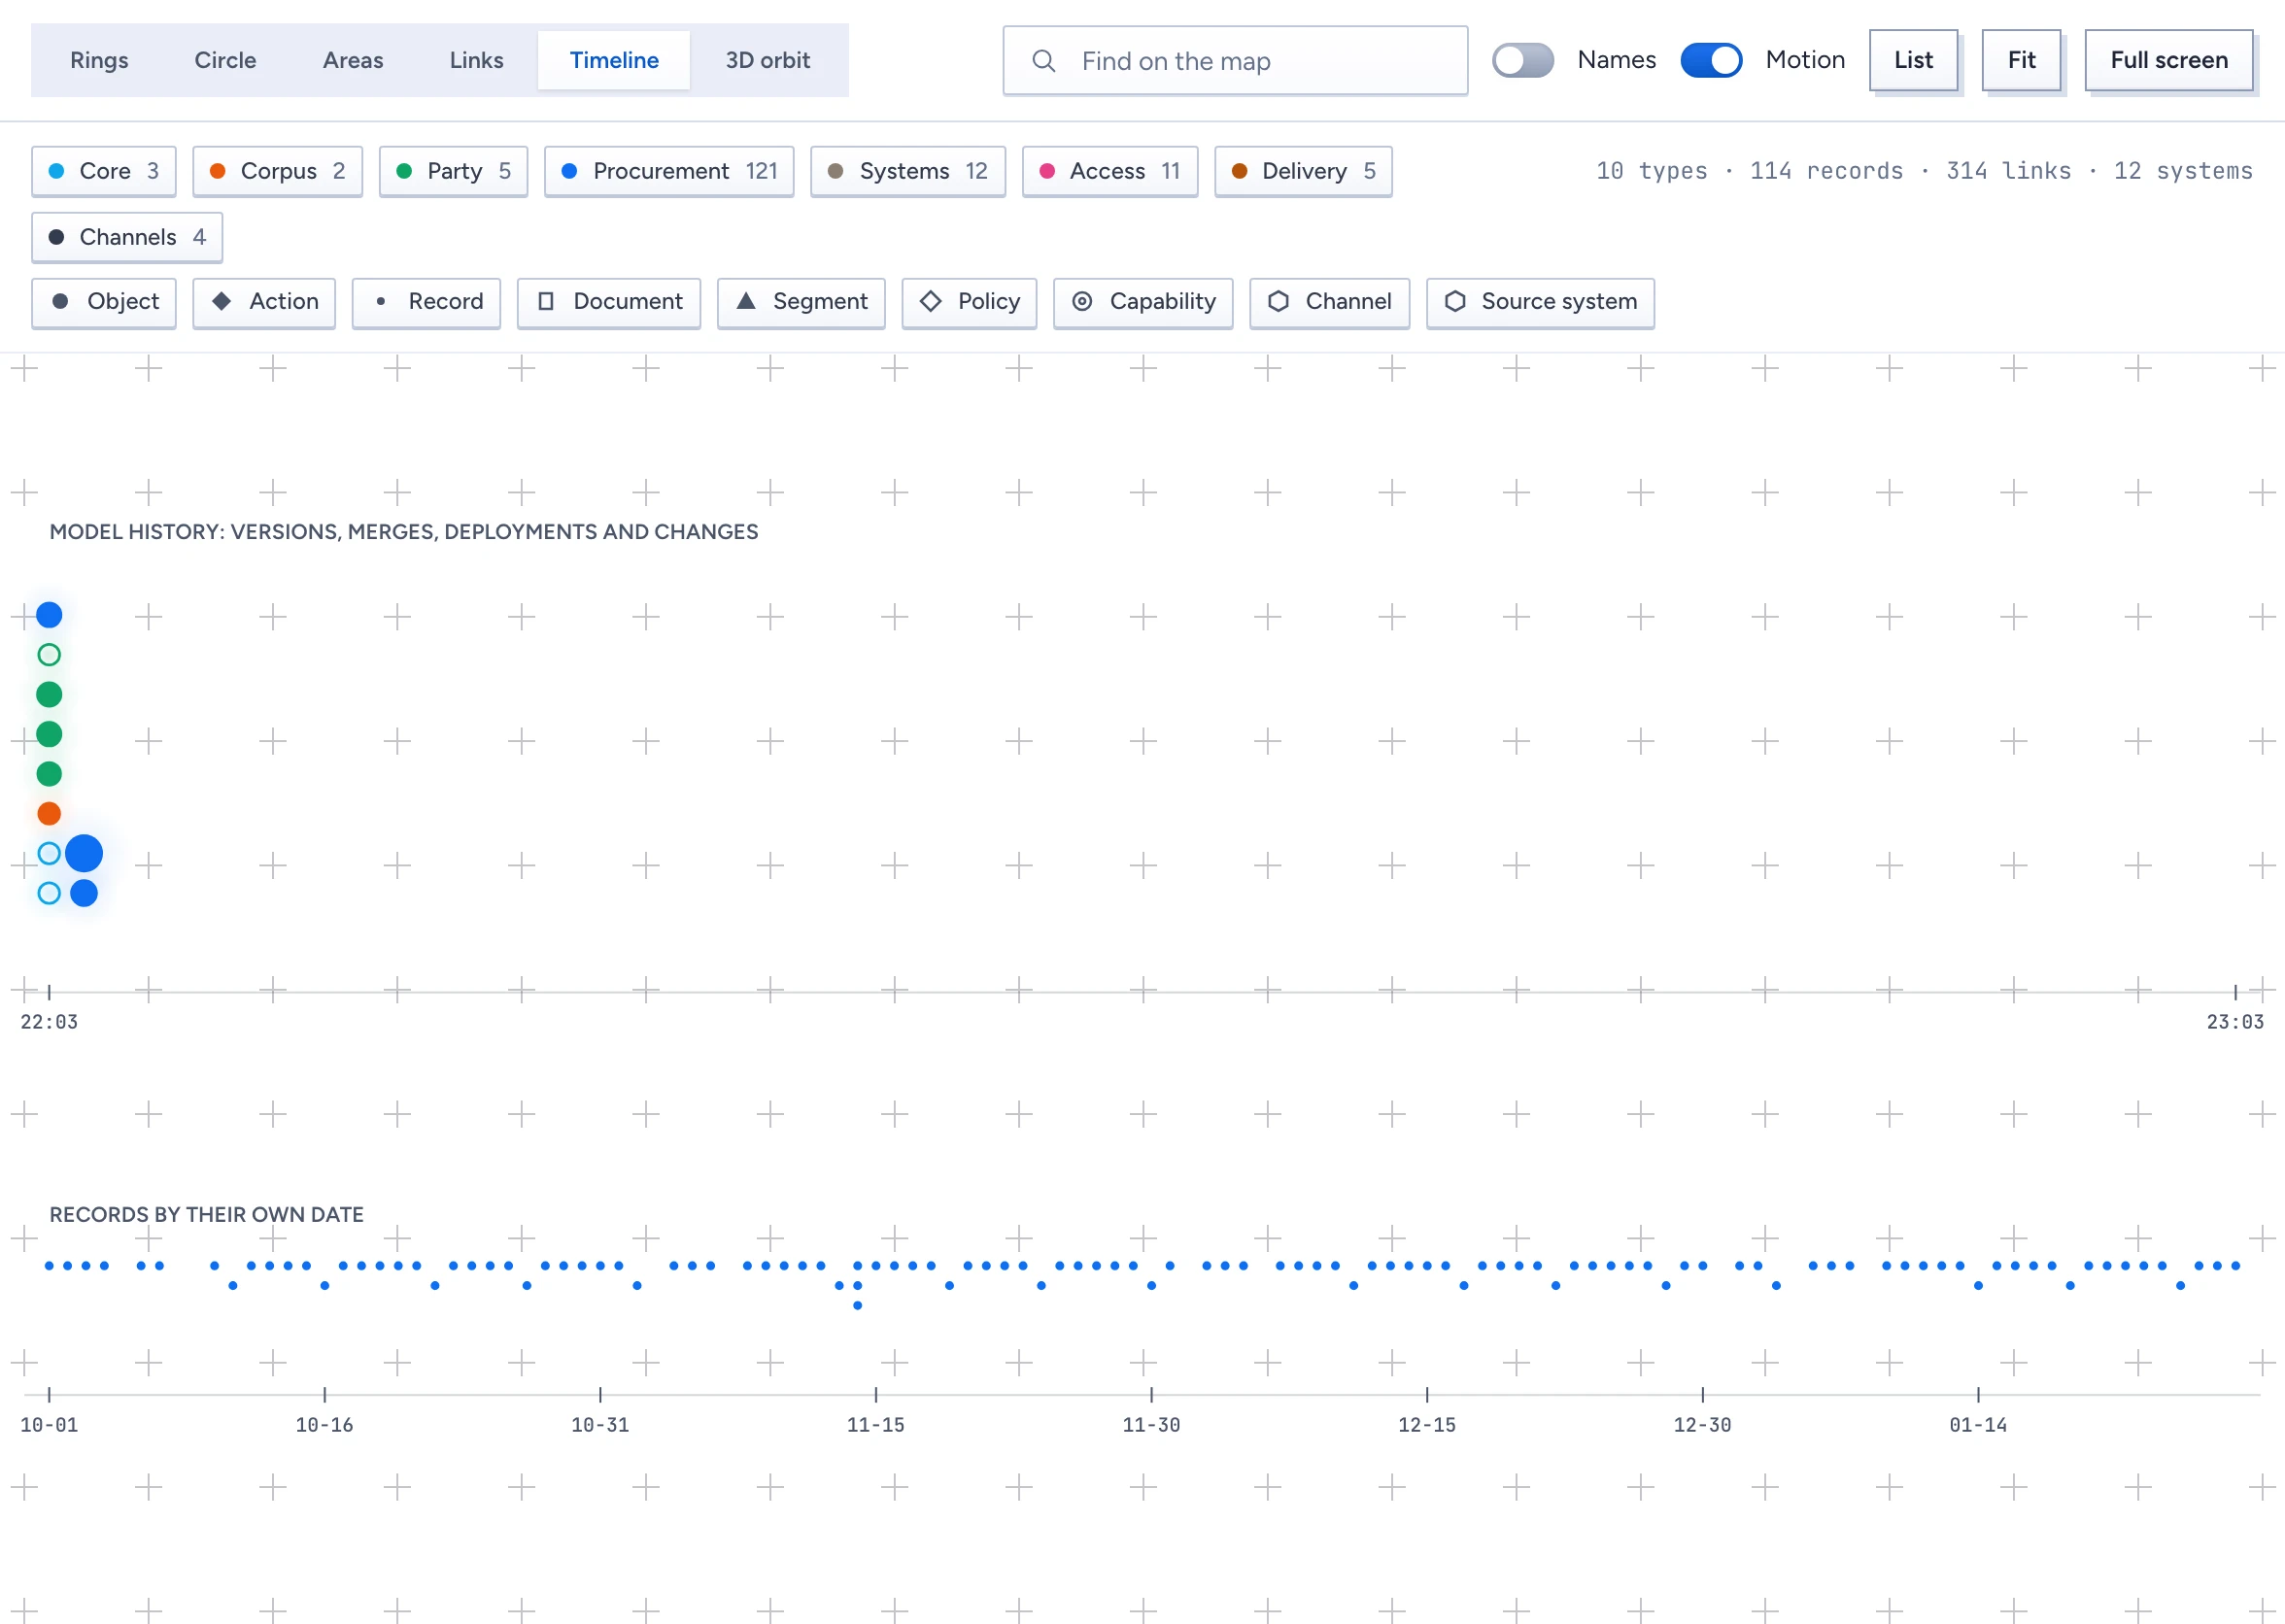
- Timeline: two bands. The top band is the model's history: versions, merges, deployments and each element's last change. The bottom band places records by their own date, such as a contract's renewal date, when you can see that date.
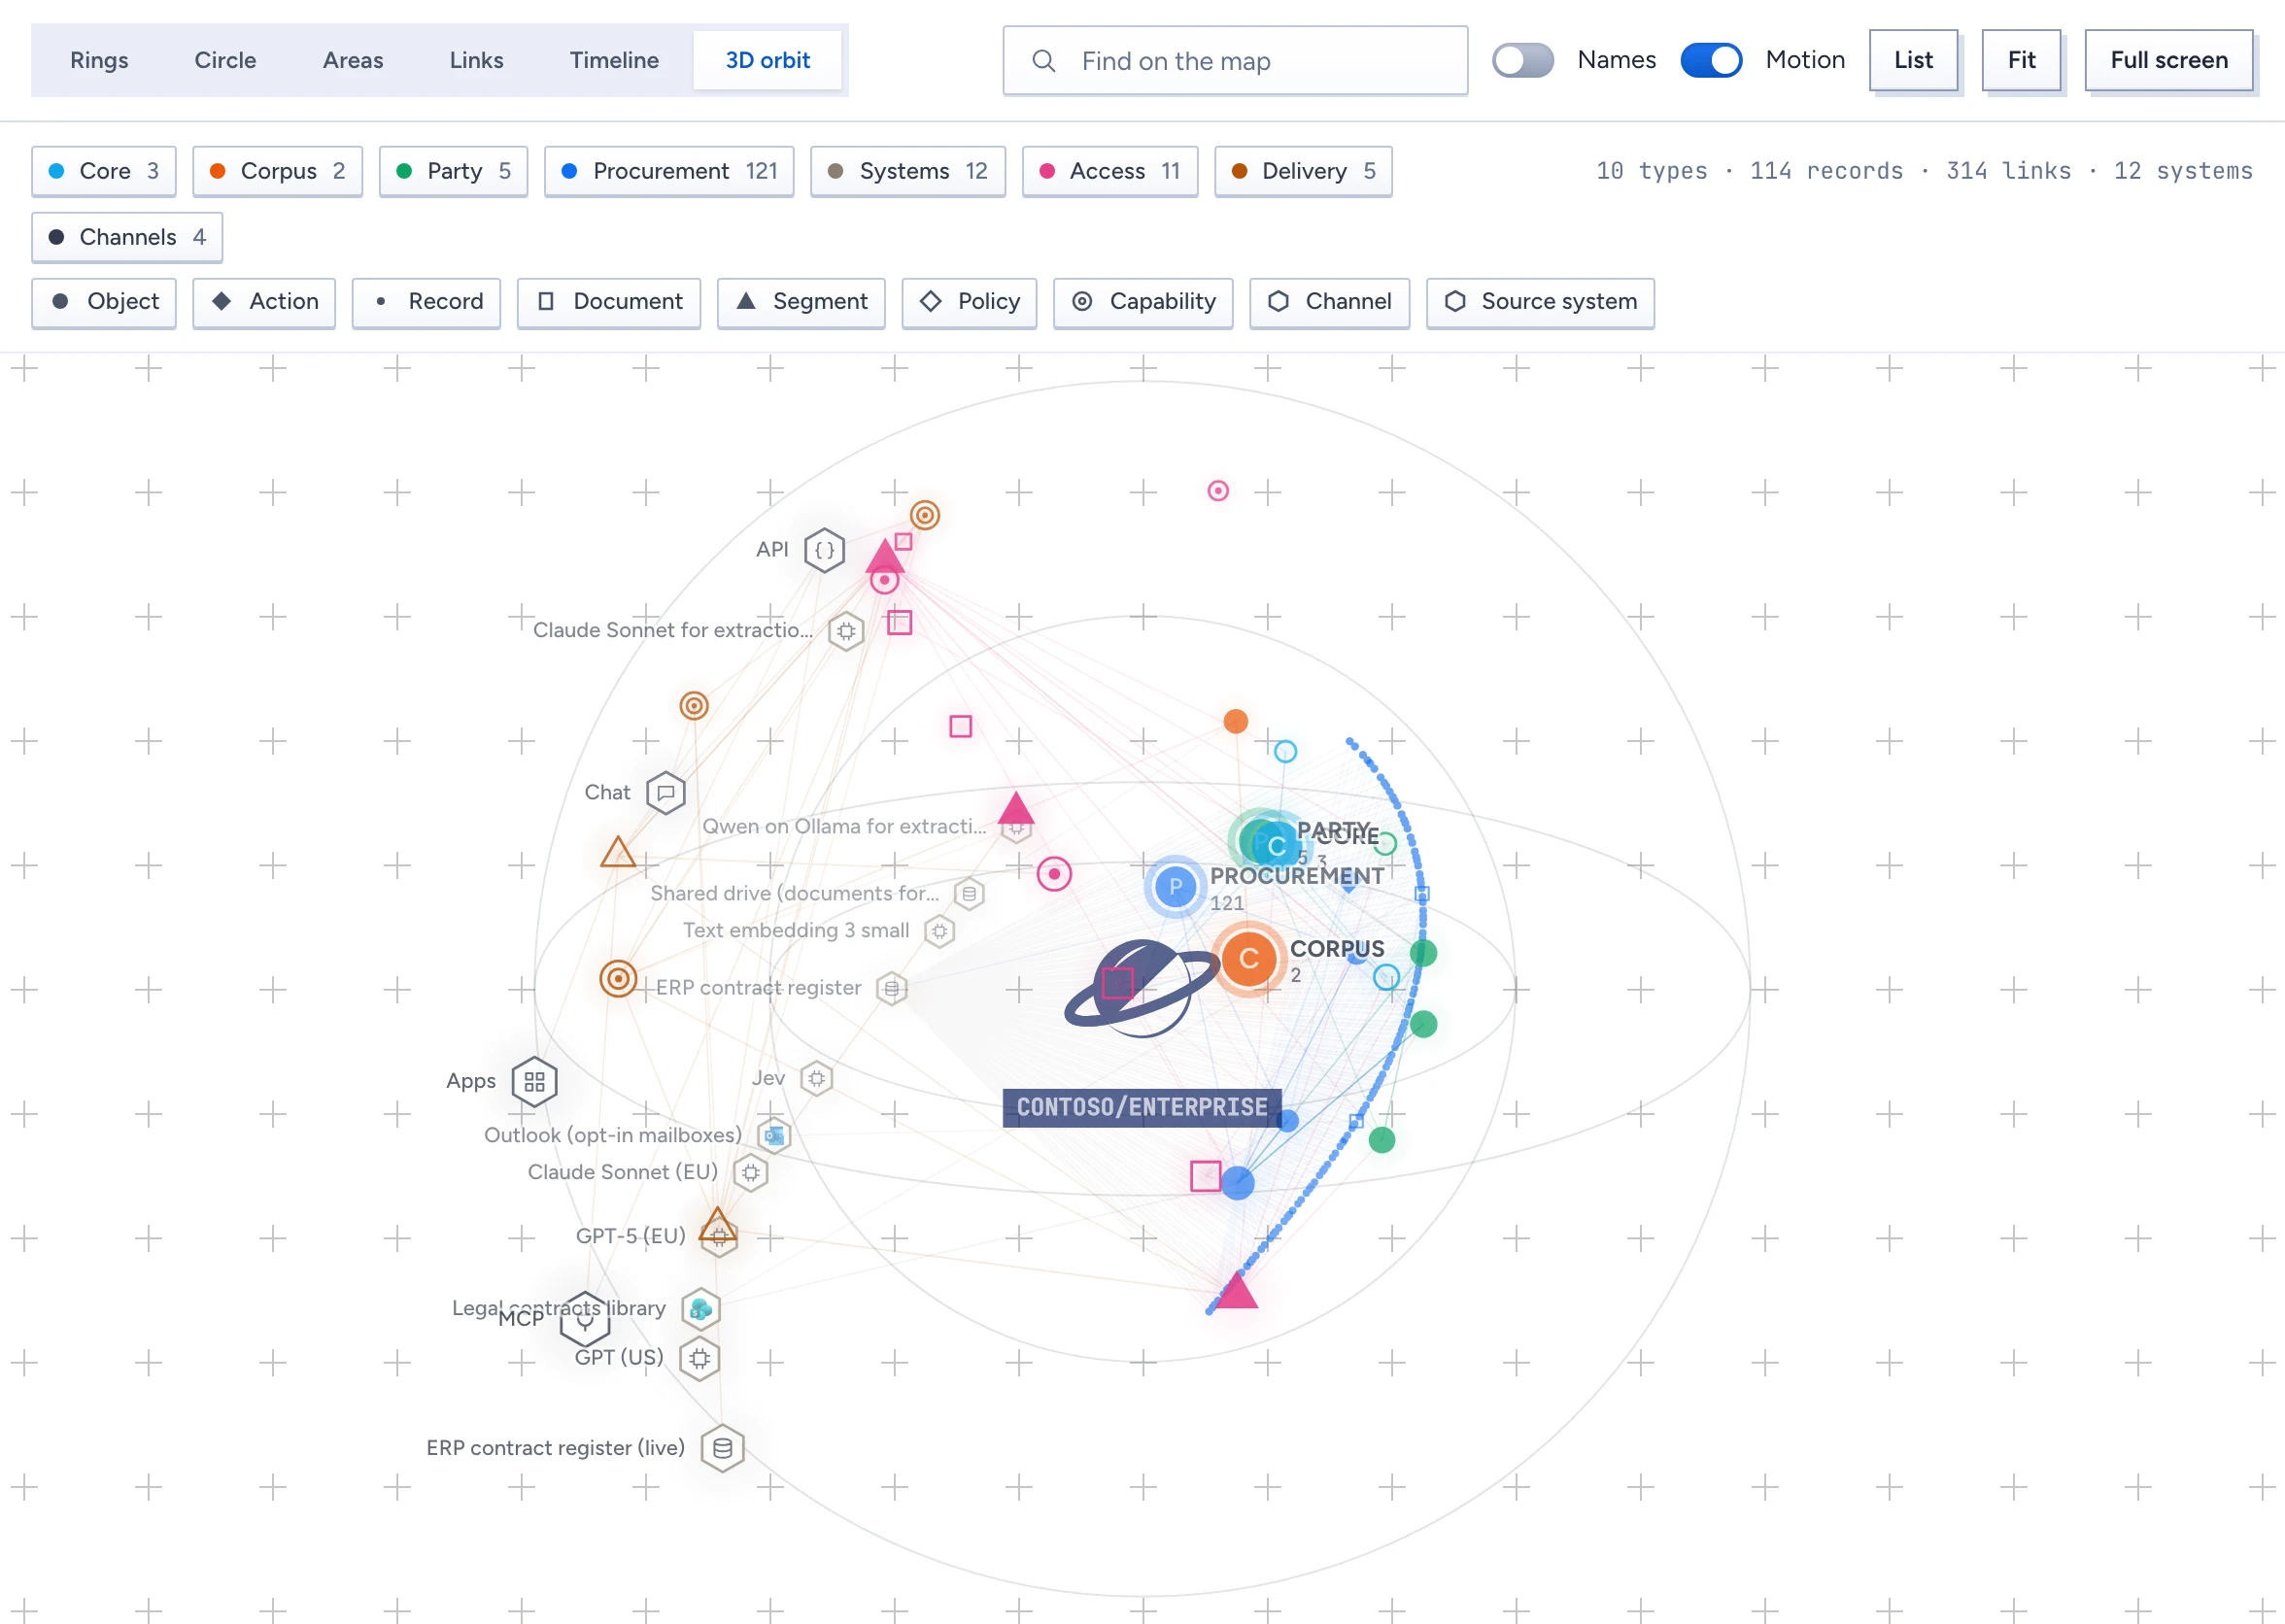
- 3D orbit: shells by layer on a slowly turning sphere, with the Gluon mark turning in the middle. Turn Motion off to stop it.
Find and trace
- Type in Find on the map. Names that start with what you typed come first. Pick a match and the map flies to it and opens its card.
- The card shows the kind, the area, the number of links, how many records you can read and a short description.
- Trace lights up everything the node reaches, one link at a time, with a pulse on each link as it is crossed. Trace a backend system to see every type and record it feeds. Trace a channel to see what reaches people through it.
- Linked to on the card lists what the node links to. Pick one to move there, so you can walk the graph from the keyboard.
- Open in designer opens a type, action or domain in the designer. Press Back in the browser to return to the map with the same node selected, in the same view.
List shows everything on the map by area as a plain list, for a screen reader or when the picture is too dense.
Hover a node to dim everything except it and its neighbours. The selected or hovered node also names the links it touches, such as a link from a contract to its supplier. Drag to pan, scroll to zoom, Fit to see everything again and Full screen for a demo. Full screen keeps your zoom and what is in the middle; press Fit to fill the larger screen. The area and kind chips hide or show what they name. Names labels every node.